
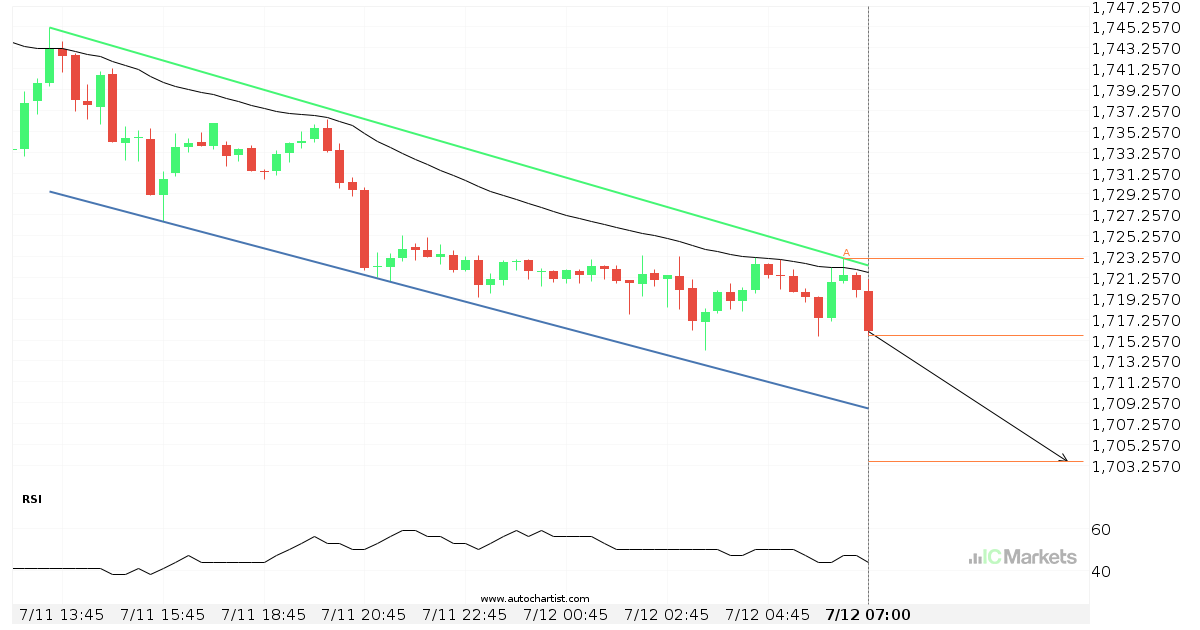
Posible ruptura del nivel de soporte en el US Small Cap 2000 Index
El US Small Cap 2000 Index avanza hacia la línea de soporte de un Canal bajista, que ya ha probado varias veces en el pasado. Hemos visto un retroceso antes desde esta línea, así que en esta etapa no está claro si atravesará esta línea o se recuperará como lo ha hecho anteriormente. Si el […]
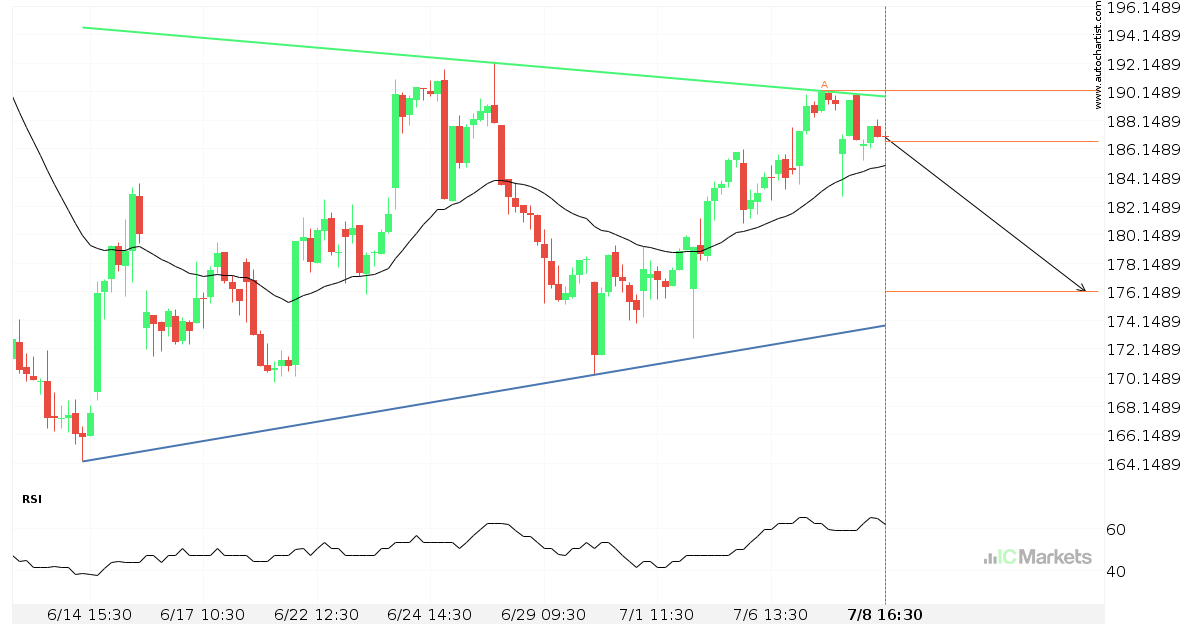
El Netflix Inc. se aproxima a el soporte de un Triángulo
El Netflix Inc. se está acercando a la línea de soporte de un Triángulo. Ha llegado a esta línea en numerosas ocasiones durante los últimos 25 días. Si vuelve a probarla de nuevo, debería hacerlo en las próximas 2 días.
Posible ruptura del nivel de resistencia en el US Small Cap 2000 Index
El US Small Cap 2000 Index avanza hacia la línea de resistencia de un Cuña ascendente, que ya ha probado varias veces en el pasado. Hemos visto un retroceso antes desde esta línea, así que en esta etapa no está claro si atravesará esta línea o se recuperará como lo ha hecho anteriormente. Si el […]
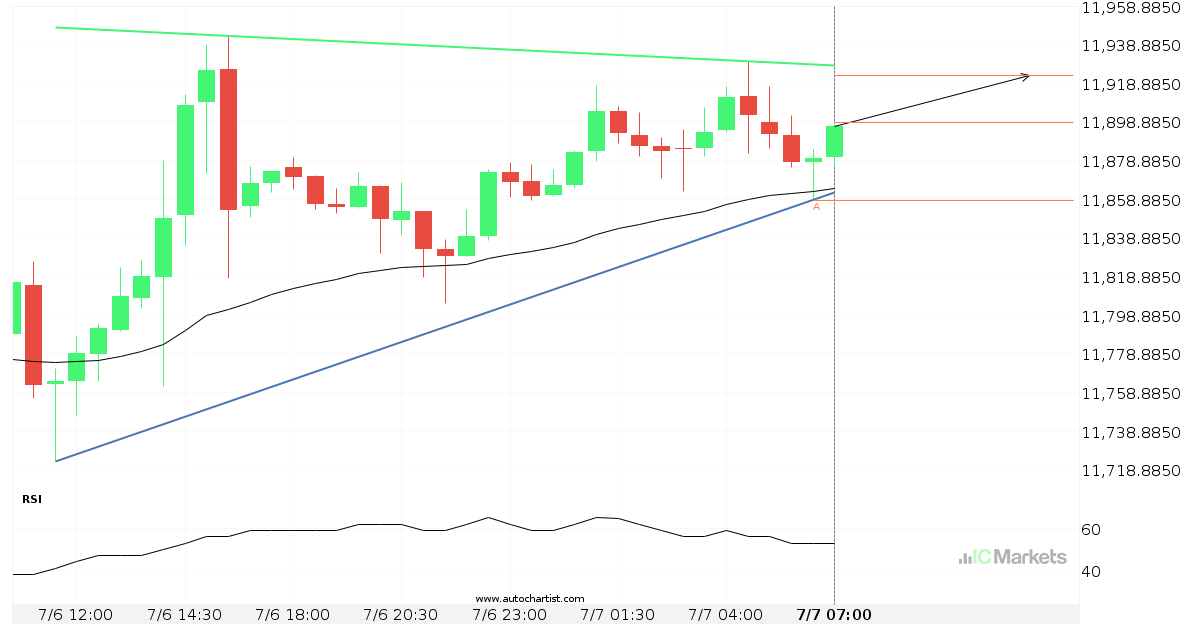
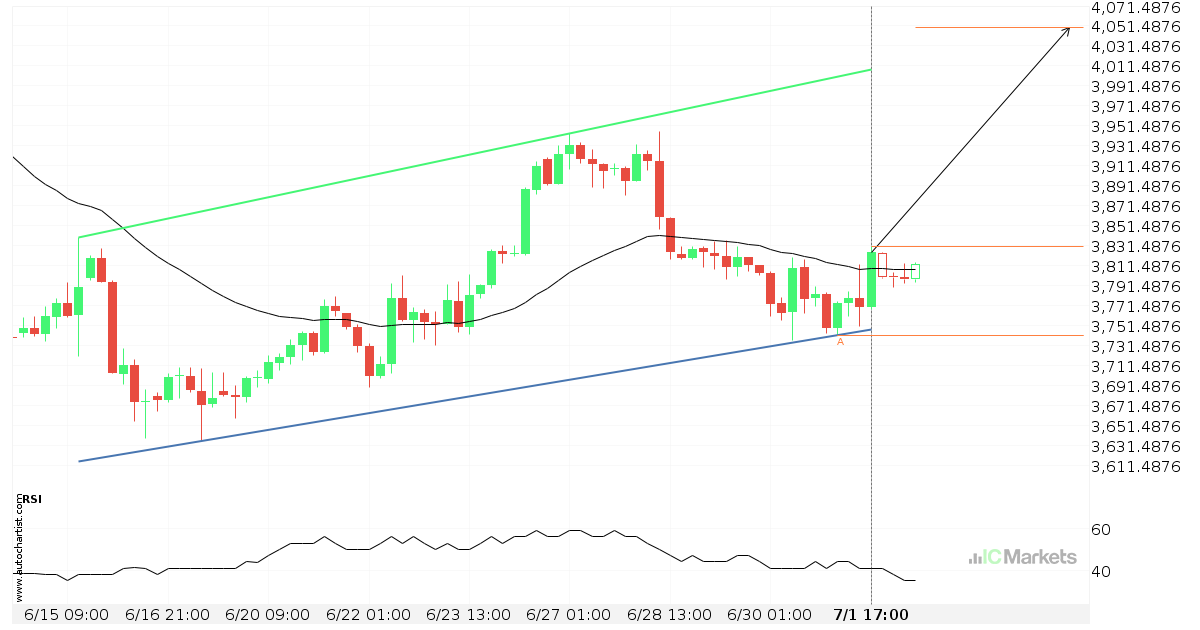
El US Tech 100 Index se aproxima a la resistencia de un Triángulo ascendente
El US Tech 100 Index se está acercando a la línea de resistencia de un Triángulo ascendente. Ha llegado a esta línea en numerosas ocasiones durante los últimos 19 horas. Si vuelve a probarla de nuevo, debería hacerlo en las próximas 5 horas.
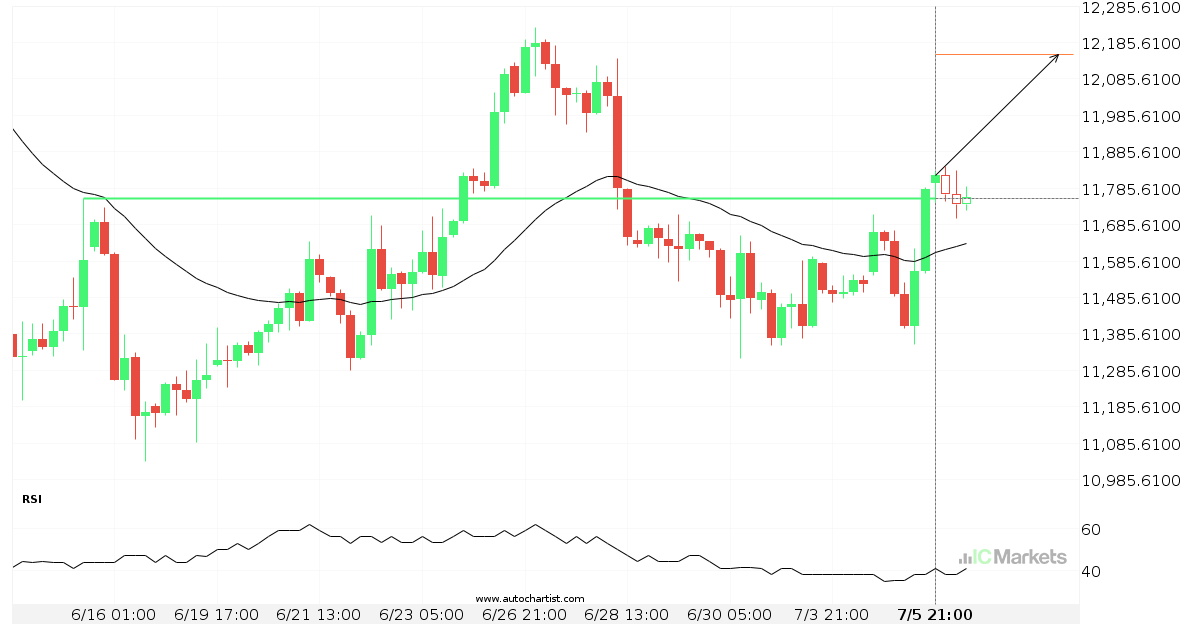
El US Tech 100 Index atravesó la importante línea de precio de 11756.2998
El US Tech 100 Index atravesó una línea de resistencia. Ha entrado en contacto con esta línea en numerosas ocasiones en los últimos 21 días. Esta irrupción muestra un movimiento potencial hacia el nivel de 12153.4297 dentro de las próximas 3 días. Ya hemos observado un retroceso desde esta posición en el pasado, por tanto, […]
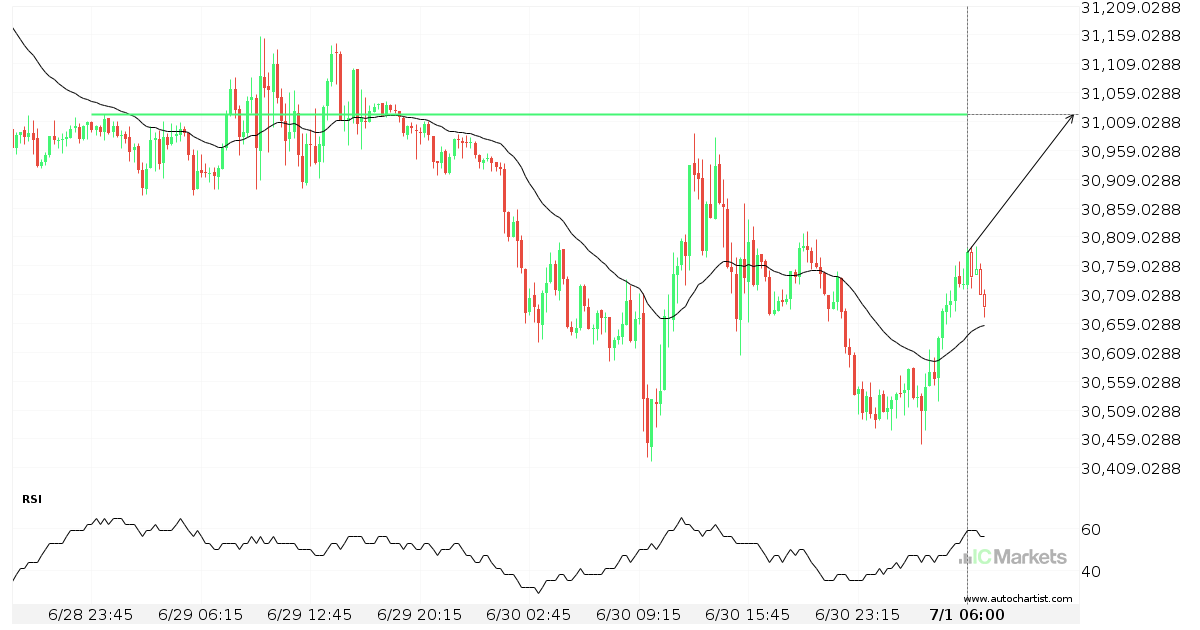
US Wall Street 30 Index – acercándose a el soporte del Triángulo
El US Wall Street 30 Index avanza hacia una línea de soporte. Como le hemos visto retroceder desde esta línea anteriormente, podríamos presenciar, o bien, una ruptura a través de esta línea o una recuperación a los niveles actuales. Ha llegado a esta línea en numerosas ocasiones en los últimos 14 días y puede probarla […]
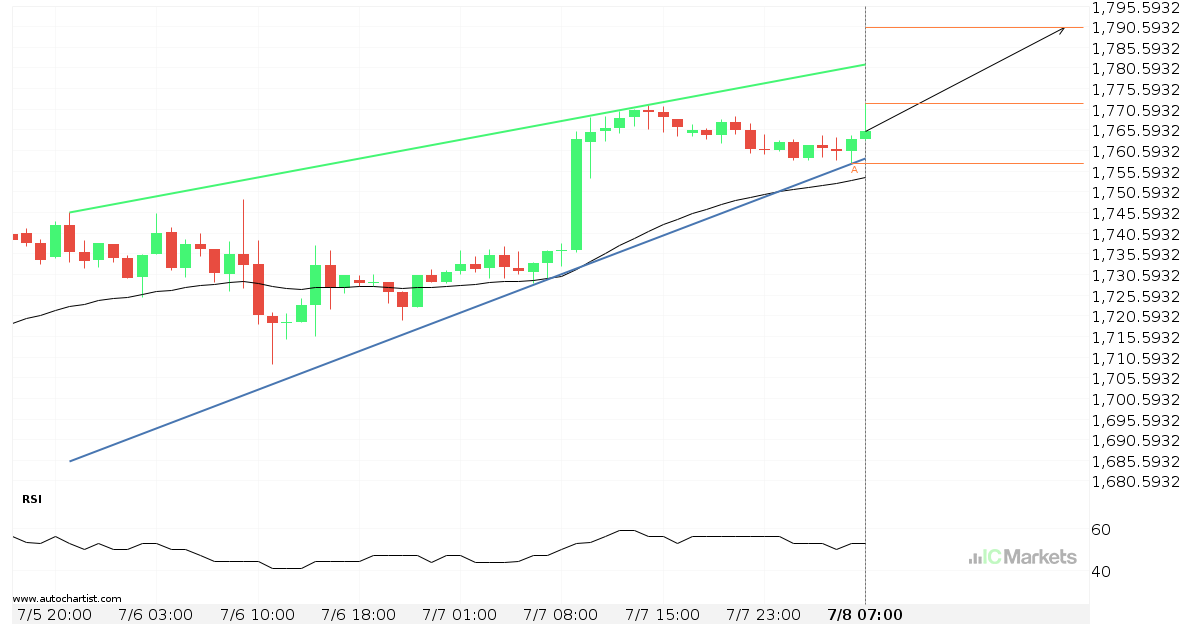
US SPX 500 Index – acercándose a la resistencia del Canal alcista
El US SPX 500 Index avanza hacia una línea de resistencia. Como le hemos visto retroceder desde esta línea anteriormente, podríamos presenciar, o bien, una ruptura a través de esta línea o una recuperación a los niveles actuales. Ha llegado a esta línea en numerosas ocasiones en los últimos 17 días y puede probarla de […]
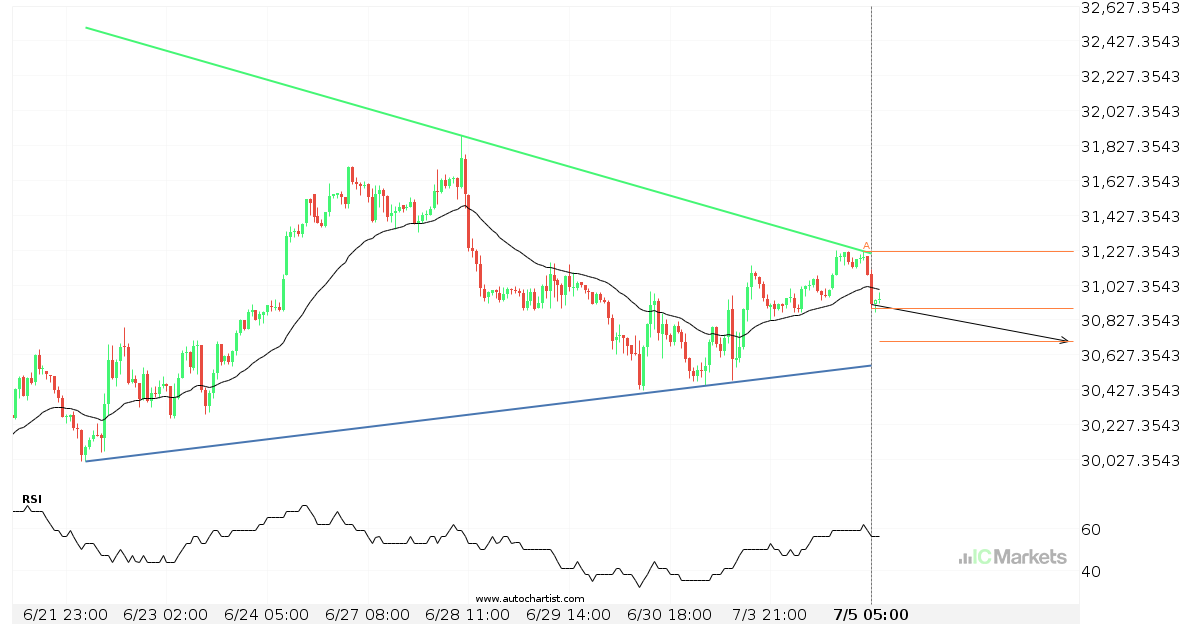
¿Deberíamos esperar una irrupción o una recuperación del US Wall Street 30 Index?
El movimiento del US Wall Street 30 Index hacia la línea de precio 31020.6992 es otra prueba más de la línea que ha alcanzado en numerosas ocasiones durante el pasado. Podríamos esperar que esta prueba ocurra en las próximas 12 horas, pero no sabemos si dará como resultado una irrupción a través de esta línea […]
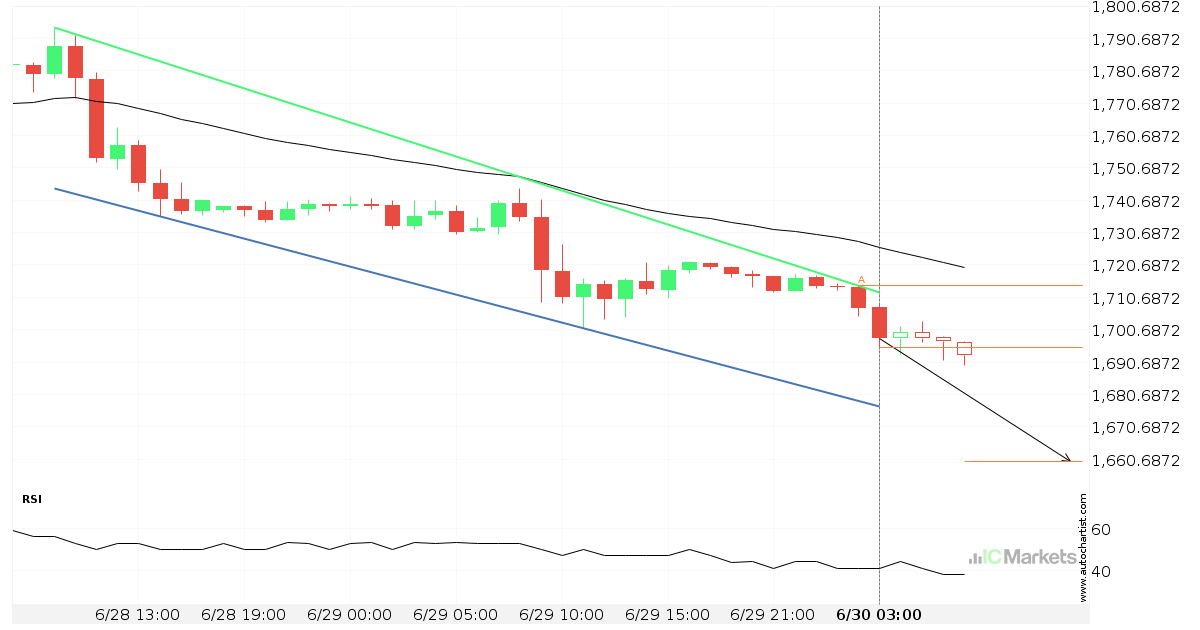
Posible ruptura del nivel de soporte en el US Small Cap 2000 Index
El US Small Cap 2000 Index avanza hacia la línea de soporte de un Canal bajista, que ya ha probado varias veces en el pasado. Hemos visto un retroceso antes desde esta línea, así que en esta etapa no está claro si atravesará esta línea o se recuperará como lo ha hecho anteriormente. Si el […]
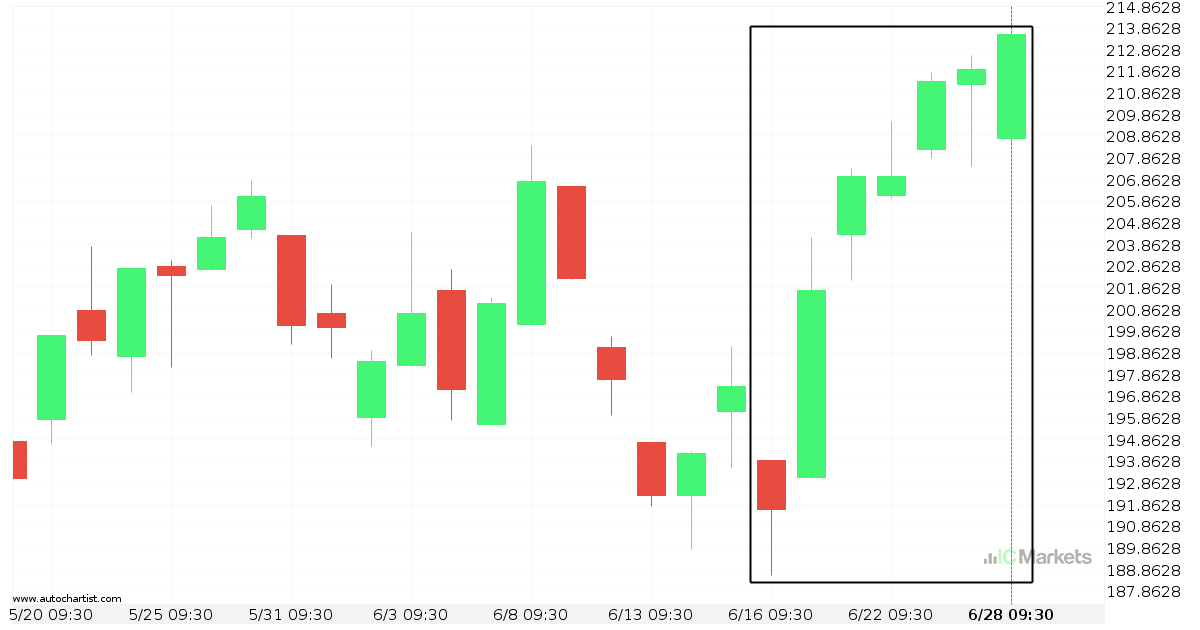
El Biogen Idec Inc está en dirección up
El Biogen Idec Inc ha experimentado un excepcional movimiento ascendente de un 11,48% de 193,89 a 213,57 en 13 días.